Using Memray and resource limits to profile memory leaks and Out of Memory (OOM) errors in Python and compiled extensions.
Performance
Published
July 2, 2026
Finding memory leaks in Python gets complicated when using compiled extensions like NumPy, PyO3, or pybind11. When the system Out of Memory (OOM) killer runs, it terminates the process with a SIGKILL without leaving a stack trace.
To debug an OOM, you need to find where the allocation occurred: in a Python object or inside a C/C++ backend.
Memray is a Python memory profiler that can track allocations down to the native level. Note that it only works on UNIX-based operating systems.
Setting Memory Limits
If the Linux OOM killer terminates the process, Memray cannot write its profile data to disk, and the capture is lost.
We can avoid this by setting a soft memory limit using Python’s built-in resource module. This forces the interpreter to raise a MemoryError before the OS terminates the process, allowing Memray to save the profile data.
A Memory Leak Example
Below is an example script that triggers an OOM using either a Python bytes object or a NumPy array.
Setting the Limit
First, we define a utility function to set the virtual memory limit.
Show the code
import osimport resourceimport secretsimport numpy as npdef limit_memory(max_bytes: int) ->None:"""Set a virtual memory limit to trigger a Python MemoryError before OS SIGKILL."""1 resource.setrlimit(resource.RLIMIT_AS, (max_bytes, max_bytes))
1
The resource.setrlimit function caps the virtual memory (RLIMIT_AS) available to the process. When memory usage exceeds this limit, the OS denies further allocations, raising a MemoryError instead of terminating the process.
Pure Python Allocation
Next, we define a function that allocates memory using Python bytes.
Show the code
def leak_python() ->None:"""Trigger an OOM error by allocating progressively larger Python bytes objects."""print("Triggering OOM with a single pure Python bytes object...") current_size =10*1024*1024# Start at 10 MB data =NonewhileTrue:if data isnotNone:1del data # Explicitly free memory before the next allocationprint(f"Attempting to allocate {current_size // (1024**2)} MB bytes object...")2 data = os.urandom(current_size)3 current_size =int(current_size *1.5)
1
Freeing the previous allocation ensures the OOM is triggered by a single large allocation failing, rather than gradual accumulation.
2
os.urandom generates uncompressible bytes, preventing OS memory compression from masking the size of the allocation.
3
Grow by 50% each iteration.
NumPy Allocation
We also define a function that allocates memory via NumPy.
Show the code
def leak_numpy() ->None:"""Trigger an OOM error by allocating progressively larger NumPy float64 arrays."""print("Triggering OOM with a single native NumPy array...") current_elements = (10*1024*1024) //8# 8 bytes per float64 arr =NonewhileTrue:if arr isnotNone:del arr # Explicitly free memory before the next allocation mb_size = (current_elements *8) // (1024**2)print(f"Attempting to allocate {mb_size} MB float64 array...")# This single C-level malloc will eventually fail and raise MemoryError1 arr = np.ones(current_elements, dtype=np.float64)2 current_elements =int(current_elements *1.5)
1
NumPy arrays are backed by C/C++ allocations. When np.ones is called, it bypasses Python’s memory manager and requests contiguous memory from the system. Without native profiling enabled, Memray would only track the Python wrapper, missing the underlying C allocation.
2
Grow by 50% each iteration.
Running the Simulator
The entry point sets the memory limit and runs one of the allocation functions.
Show the code
if__name__=="__main__":1 limit_memory(1*1024**3)try:if secrets.choice([True, False]): leak_python()else: leak_numpy()2exceptMemoryError:print("\n[!] MemoryError caught. Memray can now flush the capture file to disk.")
1
Restricts the process to exactly 1 GB of virtual memory.
2
Catching MemoryError allows the script to exit gracefully. This is required for Memray to flush its buffers and write the profile data to disk.
Running the Profiler
To capture native allocations, run the script with the --native flag:
memray run --native oom_simulator.py
This generates a binary capture file (e.g., memray-oom_simulator.py.12345.bin).
Analyzing the Results
Memray provides several formats to analyze the generated binary file.
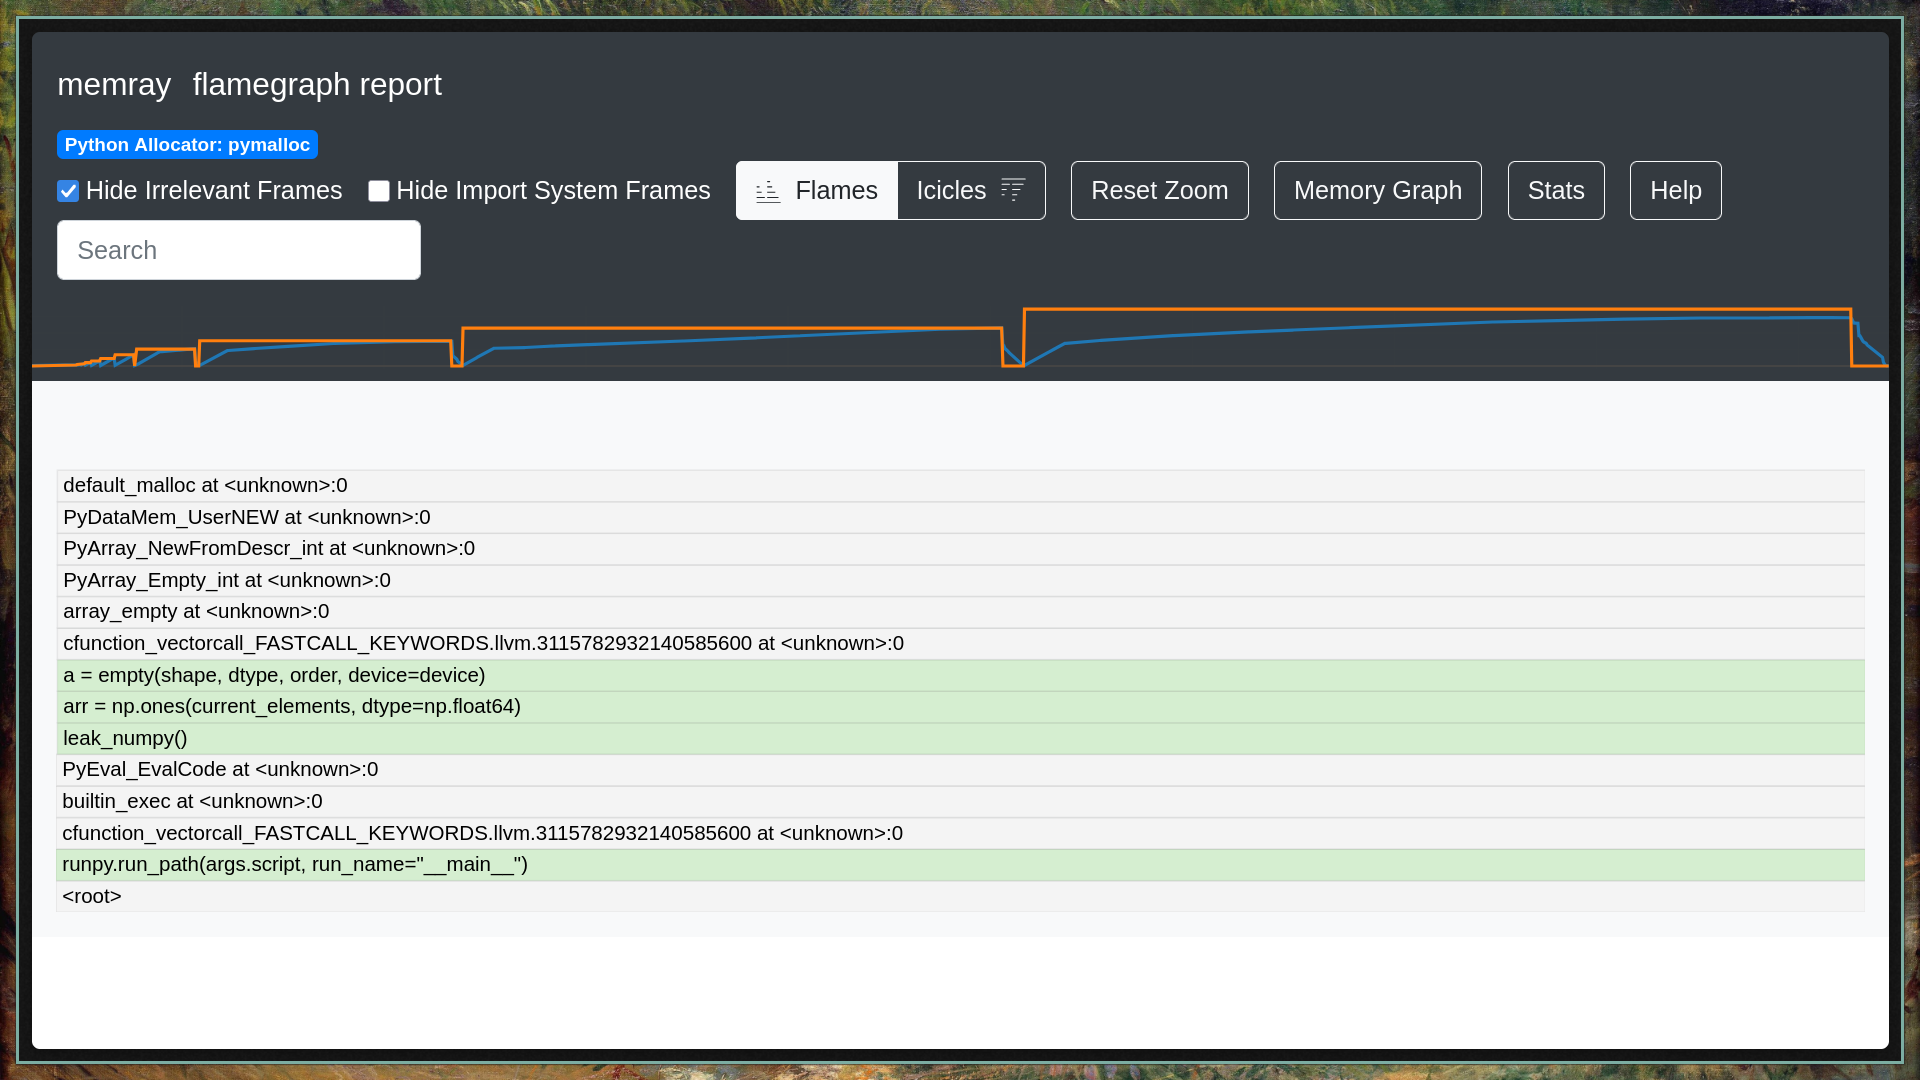
HTML Flamegraph
You can generate an interactive HTML flamegraph to visualize allocations:
This will produce an HTML file that you can open in a browser.
Python Allocation: The graph will show a large block for os.urandom.
NumPy Allocation: The graph will show the call stack going from Python into numpy.core.multiarray.ones and down to the C allocation function that blew the 1 GB limit.
Memray Flamegraph
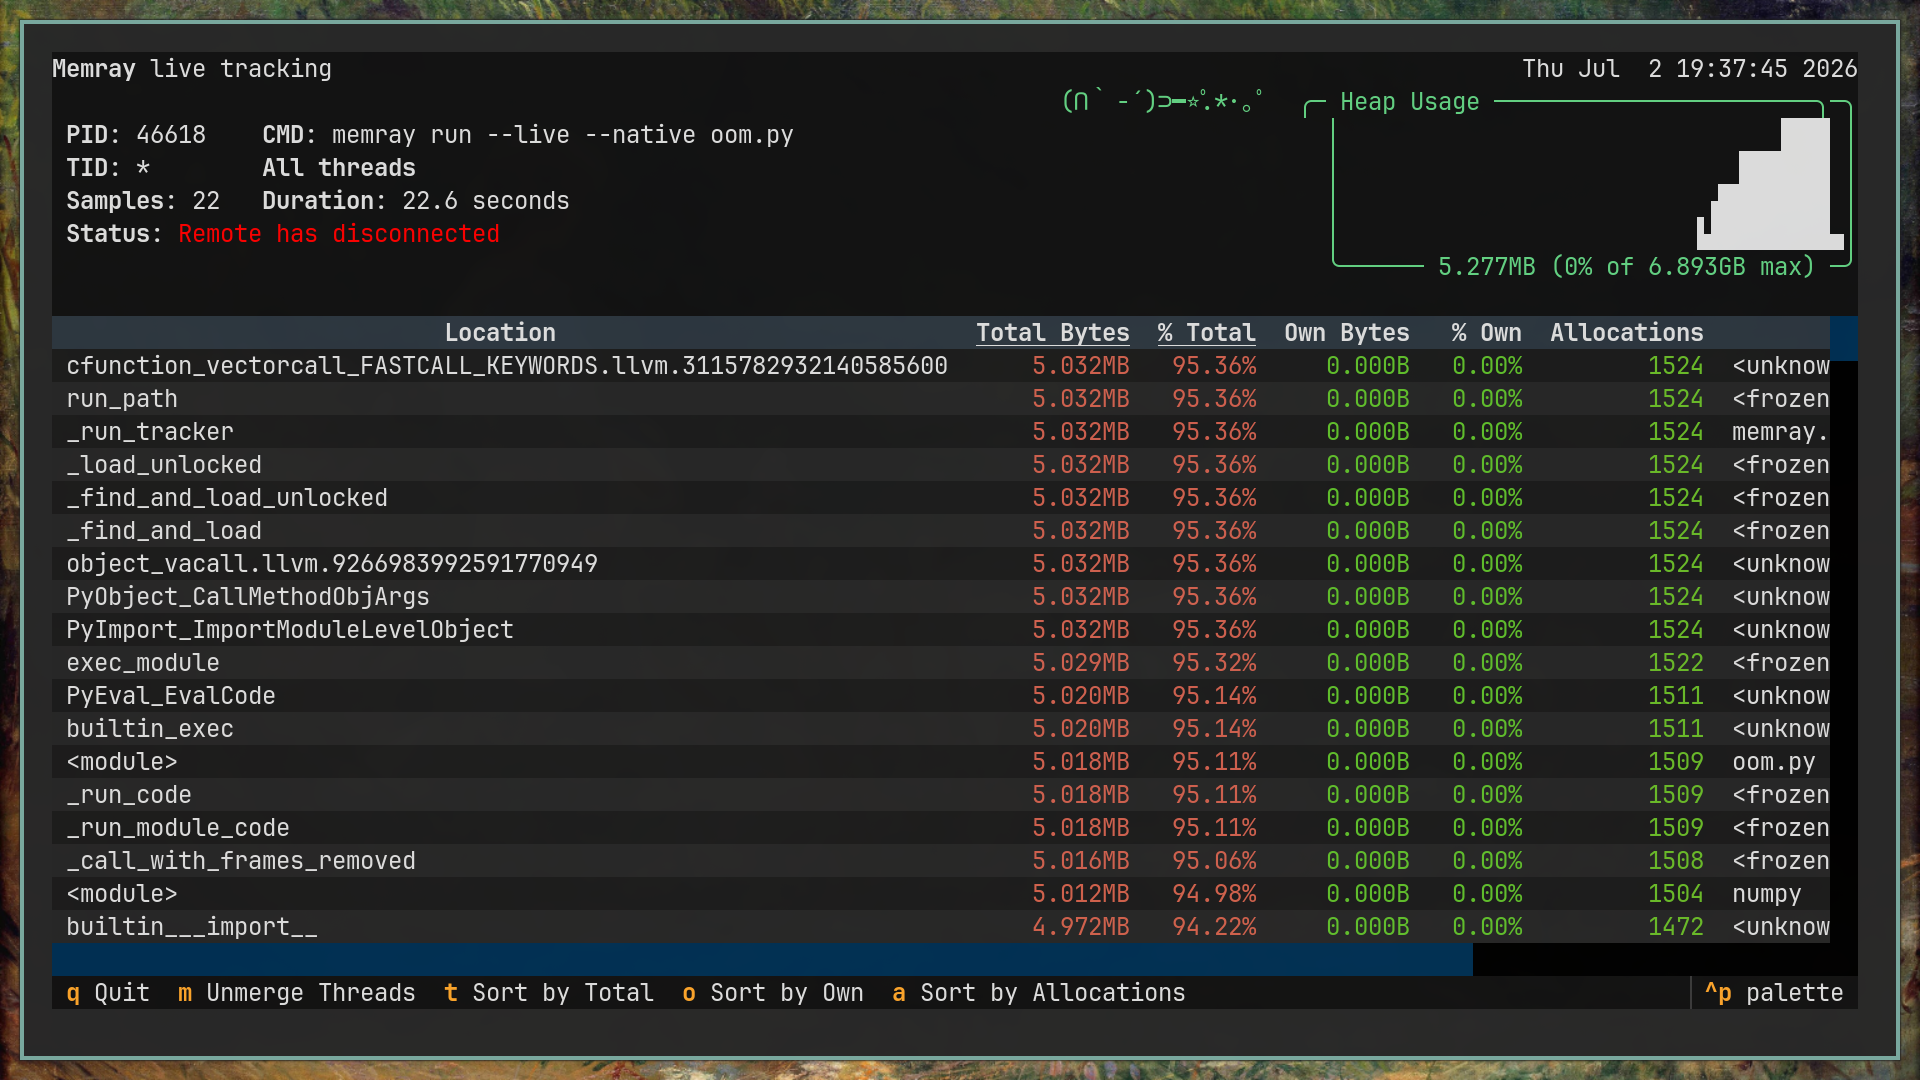
Live Terminal UI
Memray includes a terminal UI (similar to htop) to view memory allocations in real time:
memray run --native--live oom_simulator.py
This shows real-time memory spikes, top allocating files, and a running plot of heap usage. It is useful for monitoring background services over SSH.
Memray Live TUI
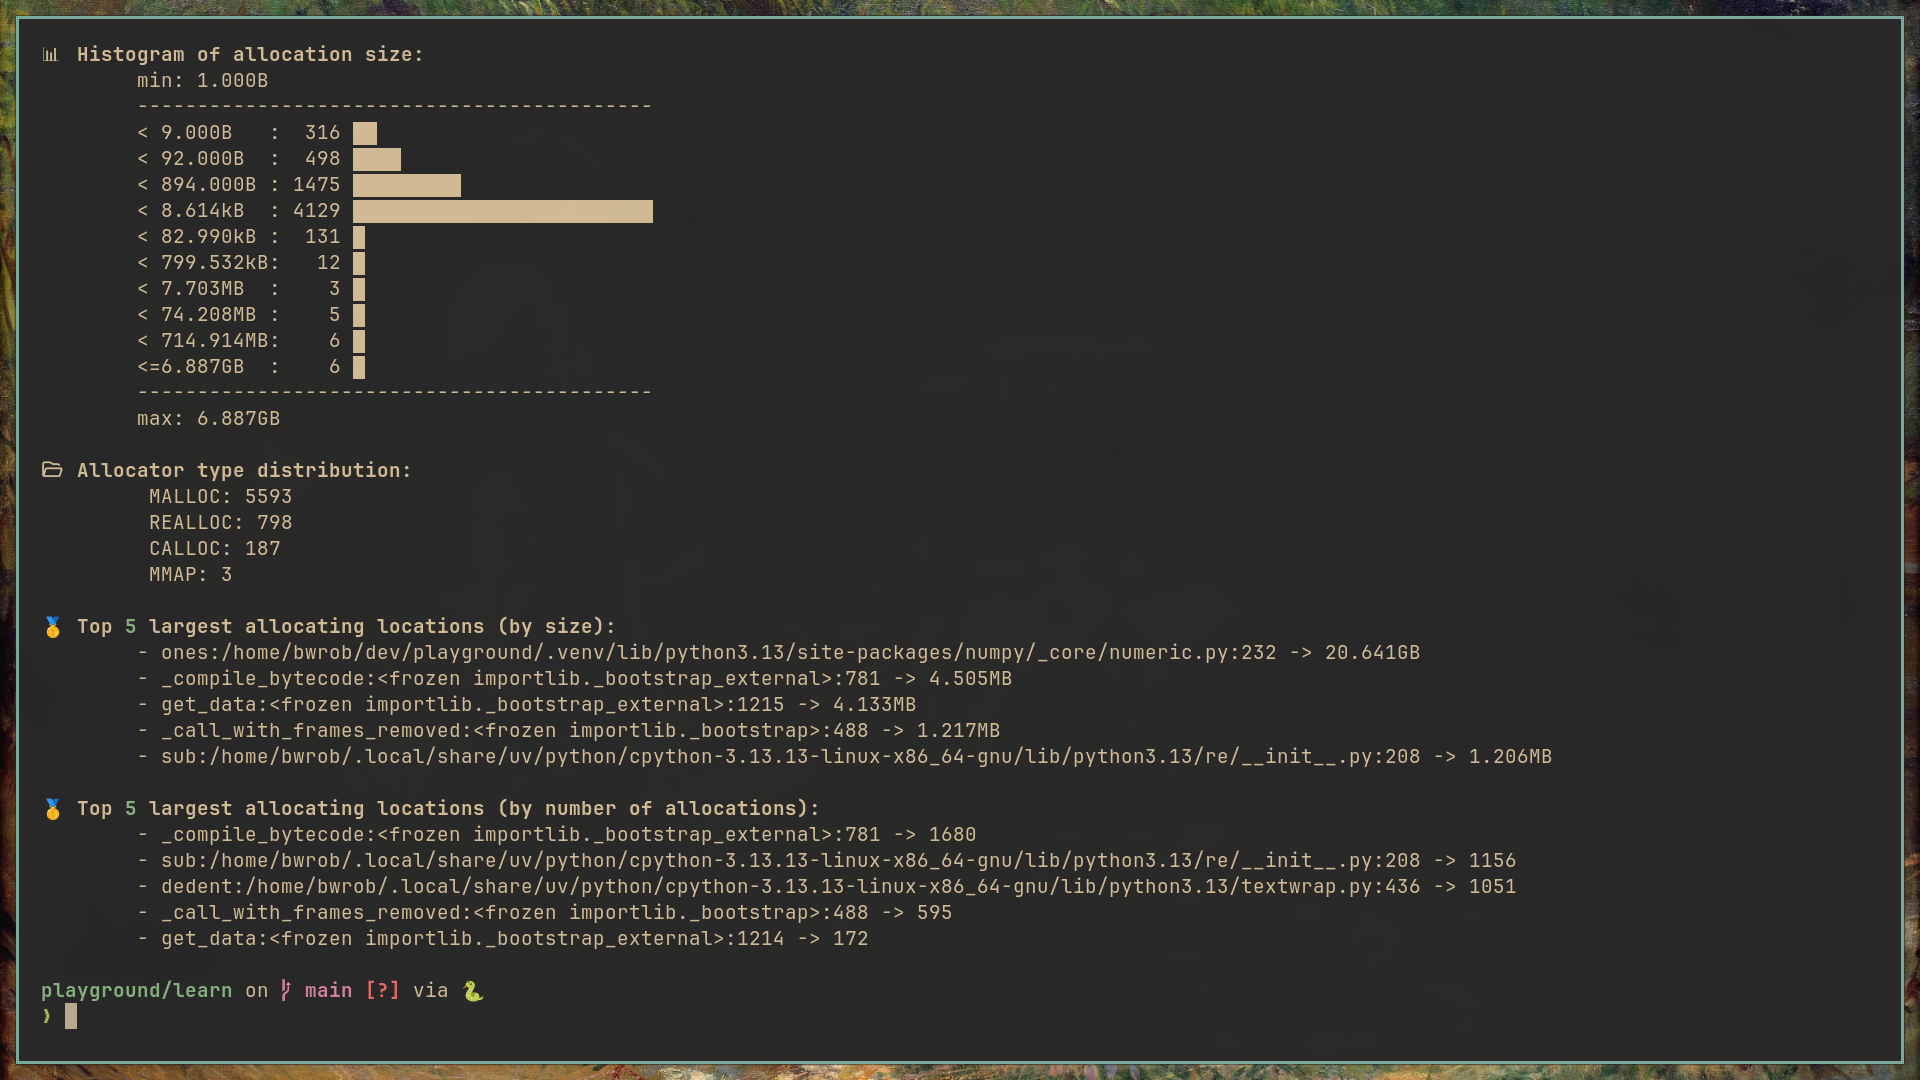
Statistics Summary
For a quick text summary of allocations, use the stats command:
memray stats memray-oom_simulator.py.12345.bin
This outputs a summary directly to the terminal, containing:
Total memory allocated.
The top allocating functions (both Python and C-level).
A histogram of allocation sizes.
Memray Stats
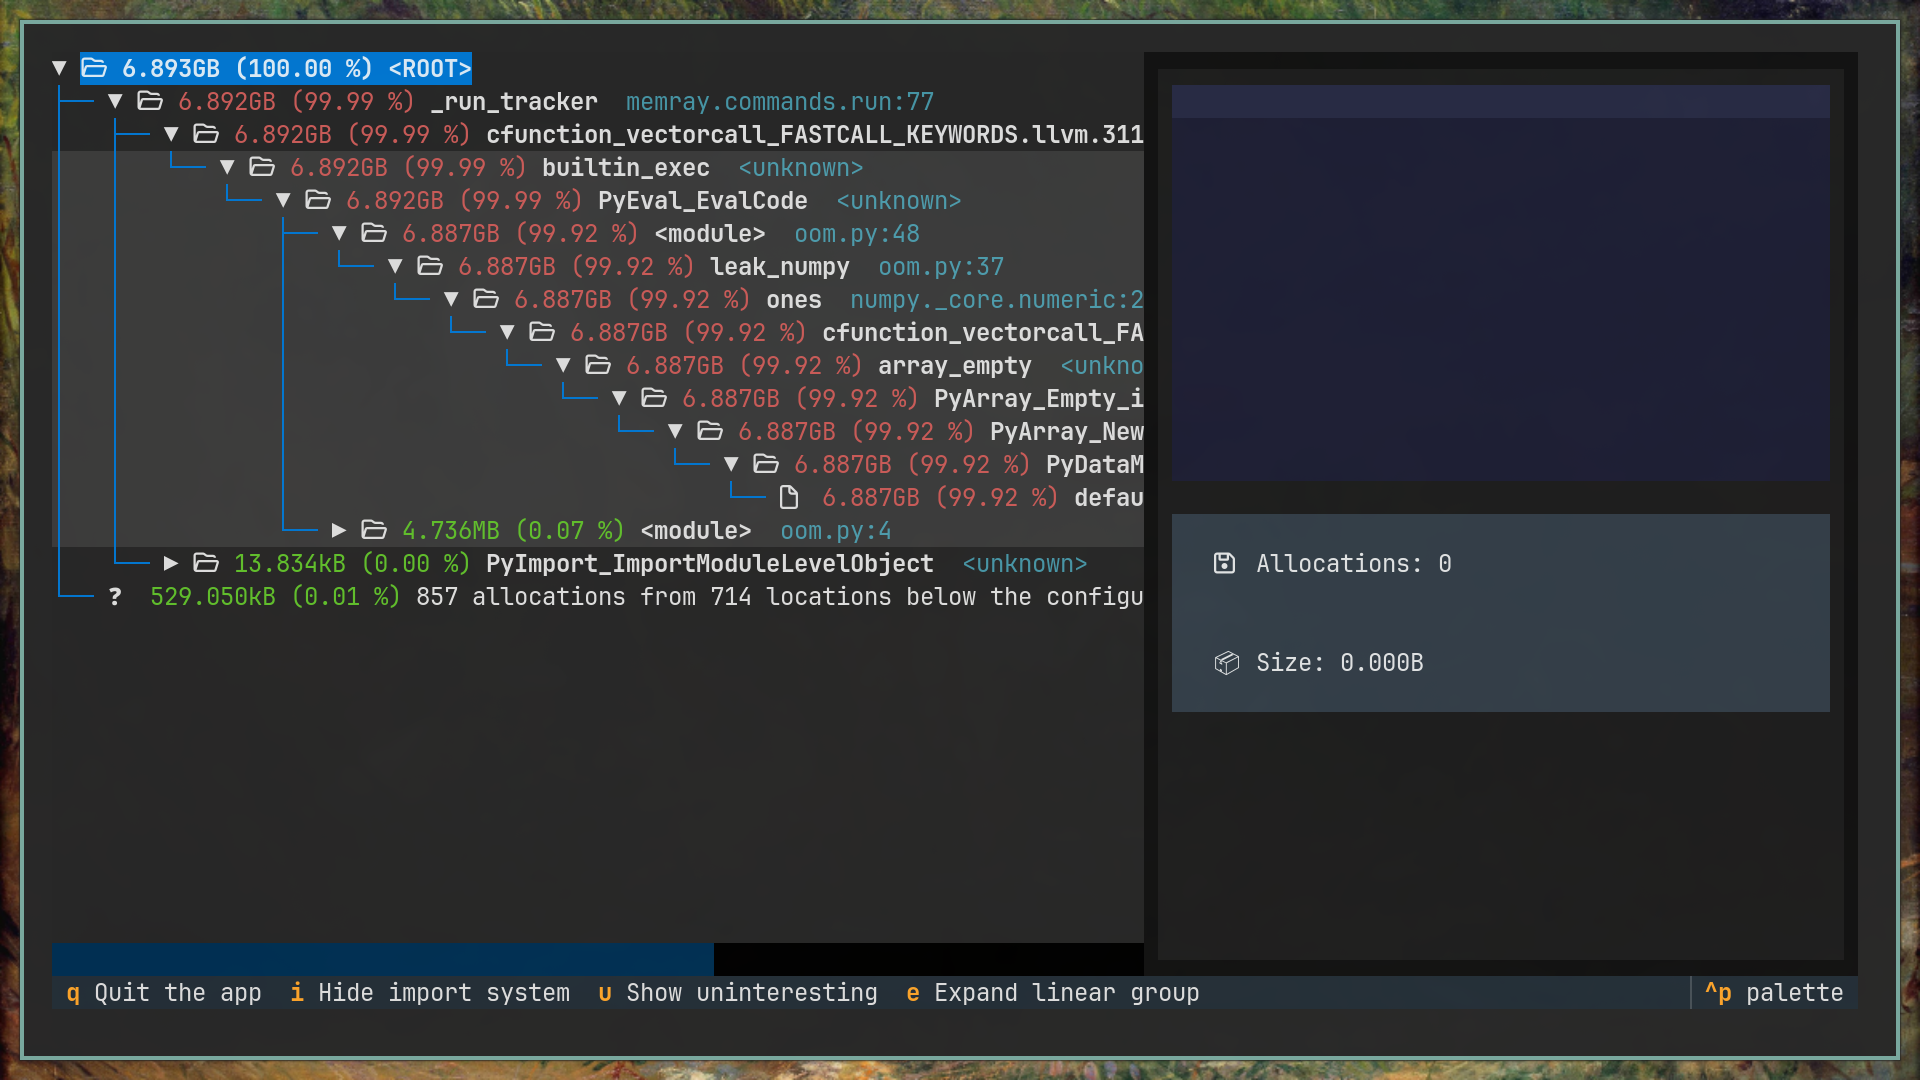
Terminal Tree View
You can also render an inverted call graph in the terminal using the tree command:
memray tree memray-oom_simulator.py.12345.bin
This visualizes the call relationships of functions that consumed memory. It helps trace a memory leak straight to the source.